 Gitlab
QEMU Log Panel
Software to visualize the qemu log and provide diff to the dump.json from our simulator. We use this to debug our simulator, the correctness of each insturction exection.
See docs/architecture.md for how the program is put together: the trace source layer, the qtrace format and its index, how the two sides of a comparison are merged, and the class / workflow / state diagrams.
What changed (August 2026): the qtrace log format
The old way of recording a trace was:
-accel tcg,one-insn-per-tb=on -d exec,cpu,nochain,in_asm,int,trace:... -plugin libmem.soThat prints all ~230 register values again for every instruction. Measured on an xv6 boot it produced 7,143 bytes per instruction at 36,700 instructions/sec. Booting xv6 to a shell takes 426 million instructions, so that recipe needed about 3.2 hours and 3 TB of disk — it never actually reached the shell.
The reason it was so wasteful: of the 232 registers printed every instruction,
192 never change at all, and 5 more (mcycle, minstret, cycle, instret,
time) change every instruction only because they are host CPU cycle counts, which
are pure noise and can never match a simulator. Real code changes about 0.35
registers per instruction.
A new QEMU plugin, qtrace, records the same information but only writes what actually changed:
| old recipe | qtrace | |
|---|---|---|
| boot xv6 to shell | ~3.2 h (never finished) | 10.6 s |
| rate | 36,700 insn/s | 40,000,000 insn/s |
| bytes per instruction | 7,143 | 29.3 |
| full boot log size | ~3 TB | 12.5 GB |
(Measured on an Apple M-series laptop, -smp 1, 427,012,268 instructions to the
shell prompt. Repeat runs land between 10.6 s and 11.8 s.)
The trace still contains everything: every instruction, every architectural register value, every guest memory access, and every trap.
This project auto-detects the format, so old logs and the new ones both work. No flag to set — it looks at the first line of the file.
Accuracy
qtrace was validated against the old tracer rather than assumed correct:
- 230 registers compared across 400,000 records — all identical. The only two that
differ are
x15/a5(9 times) andstimecmp, both fed byrdtime. Running the same tracer twice produces those same differences, so that is guest-timer non-determinism, not a tracing error. - The plugin can audit itself:
verify=onreads the whole register file on every instruction and reports anything the fast path missed. It reports 0 mispredicted writes over 5 million instructions. - The parallel HSQLDB import was checked against a single-threaded replay of the same log, including rows either side of every chunk boundary — identical.
Where the source actually lives
All the QEMU-side and xv6-side changes are kept in this repository, under
qtrace/:
| file | what it is |
|---|---|
qtrace/qtrace.c |
the tracer, a QEMU TCG plugin (~1000 lines) |
qtrace/qtrace-expand.py |
converts a delta log back to the legacy full dump |
qtrace/xv6-riscv.patch |
the xv6 Makefile, kernel/memlayout.h and .gitignore changes |
qtrace/install.sh |
copies the above into a QEMU tree and patches xv6 |
They live here rather than in the QEMU tree because a QEMU source tree is usually an unpacked tarball with no version control of its own, so nothing in it survives moving to another machine. Keeping them here means this repository is the only thing you have to clone.
install.sh is safe to run more than once; it reports what it changes and leaves an
already-installed tree alone.
Setting up a new computer
Everything below assumes the three projects live side by side in ~/workspace:
~/workspace/qemu             # QEMU with the qtrace plugin
~/workspace/xv6-riscv        # the guest
~/workspace/qemu-log-panel   # this project
The xv6 Makefile defaults to QEMUSRC = $(HOME)/workspace/qemu. If you put QEMU
somewhere else, pass QEMUSRC=/your/path to make or edit that line.
The whole thing, copy and paste
For macOS with Homebrew. Each step is explained underneath if something goes wrong.
# 1. tools
brew install glib pkgconf ninja meson python3 maven openjdk@21
brew install riscv64-elf-gcc riscv64-elf-binutils riscv64-elf-gdb
brew install lzo
# Recommended full set for a source build on Intel Mac:
brew install glib pixman libpng jpeg-turbo ncurses zstd snappy libslirp dtc \
             meson ninja pkgconf python
export JAVA_HOME=/opt/homebrew/opt/openjdk@21
export PATH=$JAVA_HOME/bin:$PATH

# 2. the three projects. QEMU must come from git, not a release tarball:
#    see "Which QEMU" below.
mkdir -p ~/workspace && cd ~/workspace
git clone https://gitlab.quantr.hk/quantr/toolchain/qemu-log-panel.git
git clone <[email protected]:mit-pdos/xv6-riscv.git>
git clone https://gitlab.com/qemu-project/qemu.git
#cd qemu && git checkout b428fe036233cbd15d37e3c027ab6ca4d3661a80 && cd ..

# 3. install the tracer into QEMU and patch xv6
~/workspace/qemu-log-panel/qtrace/install.sh ~/workspace/qemu ~/workspace/xv6-riscv

# 4. build QEMU (riscv64 only, under a minute)
cd ~/workspace/qemu && mkdir -p build-rv && cd build-rv
LIBICONV_PREFIX=$(brew --prefix libiconv)
LZO_PREFIX=$(brew --prefix lzo)
SNAPPY_PREFIX=$(brew --prefix snappy)
DTC_PREFIX=$(brew --prefix dtc)
AR=/usr/bin/ar RANLIB=/usr/bin/ranlib ../configure --target-list=riscv64-softmmu --enable-plugins \
             --disable-docs --disable-werror \
             --extra-cflags="-I$LIBICONV_PREFIX/include -I$LZO_PREFIX/include -I$SNAPPY_PREFIX/include -I$DTC_PREFIX/include" \
             --extra-ldflags="-L$LIBICONV_PREFIX/lib -L$LZO_PREFIX/lib -L$SNAPPY_PREFIX/lib -L$DTC_PREFIX/lib"
ninja qemu-system-riscv64 contrib/plugins/libqtrace.dylib
sudo make install

# 5. build xv6 and the log panel
cd ~/workspace/xv6-riscv && make
cd ~/workspace/qemu-log-panel && mvn package

# 6. record a trace and import a window of it
cd ~/workspace/xv6-riscv
make qemu2                                      # ctrl-a x to quit
make hsqldb DB_START=1000000 DB_COUNT=200000
On Debian/Ubuntu replace step 1 with the apt line below, drop the --extra-cflags /
--extra-ldflags from step 4, and build contrib/plugins/libqtrace.so instead of
.dylib.
1. Prerequisites
macOS
brew install glib pkgconf ninja meson python3 maven openjdk@21
brew install riscv64-elf-gcc riscv64-elf-binutils riscv64-elf-gdb
Debian / Ubuntu
sudo apt install build-essential ninja-build meson pkg-config python3 \
                 libglib2.0-dev libpixman-1-dev flex bison \
                 gcc-riscv64-linux-gnu binutils-riscv64-linux-gnu gdb-multiarch \
                 maven openjdk-21-jdk
The xv6 Makefile finds the cross compiler itself; any of
riscv64-unknown-elf-, riscv64-elf-, riscv64-none-elf-,
riscv64-linux-gnu- or riscv64-unknown-linux-gnu- will do.
On macOS Maven will not see the JDK unless you point it at one:
export JAVA_HOME=/opt/homebrew/opt/openjdk@21
export PATH=$JAVA_HOME/bin:$PATH
2. Install the tracer, then build QEMU
~/workspace/qemu-log-panel/qtrace/install.sh ~/workspace/q ~/workspace/xv6-riscvThat does three things, all of which you can also do by hand:
- copies
qtrace/qtrace.candqtrace/qtrace-expand.pyinto<qemu>/contrib/plugins/ - adds one line,
'qtrace.c',, to thecontrib_pluginslist in<qemu>/contrib/plugins/meson.build - applies
qtrace/xv6-riscv.patchto the xv6 tree
Then build. Only the RISC-V target is needed, which takes well under a minute instead of the ~20 a full QEMU build needs.
cd ~/workspace/q
mkdir -p build-rv && cd build-rv
../configure --target-list=riscv64-softmmu --enable-plugins \
             --disable-docs --disable-werror
ninja qemu-system-riscv64 contrib/plugins/libqtrace.dylib   # .so on Linux
On macOS, if configure cannot find libiconv, add:
--extra-cflags="-I/opt/homebrew/opt/libiconv/include -I/usr/local/include" \
--extra-ldflags="-L/opt/homebrew/opt/libiconv/lib -L/usr/local/lib"
You should end up with:
~/workspace/q/build-rv/qemu-system-riscv64
~/workspace/q/build-rv/contrib/plugins/libqtrace.dylib     (or .so)
--enable-plugins is required; without it the plugin is not built and -plugin
will not work.
Which QEMU
qtrace needs plugin API version 7, which at the time of writing is only on QEMU's
development branch — it is not in any released tarball, so qemu-11.0.0.tar.xz and
older will not compile the plugin. Check before building:
grep 'define QEMU_PLUGIN_VERSION' ~/workspace/q/include/plugins/qemu-plugin.h
# needs 7 or higher
The version history is in that same header. What qtrace depends on:
| needs | first released in | why |
|---|---|---|
qemu_plugin_read_register |
v10.1.0 (API 5) | reading register values |
| discontinuity callback | v10.2.0 (header still said API 5) | detecting traps |
userdata on every callback |
development branch only (API 7) | the callback signatures qtrace uses |
For reference: v10.1.0 reports API 5 and has no discontinuity callback, v10.2.0 reports 5 and has it, v11.0.0 reports 6, and the pinned commit reports 7.
The commit pinned above (b428fe0362, QEMU 11.0.92 / v11.1.0-rc2) is the one this was
developed and tested against. A newer commit should also work as long as the API
version is still 7; if QEMU bumps it again the plugin may need its callback signatures
adjusted, and it will fail to compile rather than misbehave.
qtrace needs no patch to QEMU itself — the earlier qemu_plugin_read_guest_virt_mem
patch is not needed and should not be re-applied (see "Removed" below).
3. Build xv6-riscv
cd ~/workspace
git clone https://github.com/quantrpeter/xv6-riscv.git
cd xv6-riscv
make
The qemu2, qemu2-fulldump, qemu3, window and hsqldb targets, and the
GUESTMEM_MB knob, come from qtrace/xv6-riscv.patch applied in step 2. It applies to
upstream mit-pdos xv6 as well as to the fork.
Check it runs with no tracing at all first:
make qemu # ctrl-a x to quit4. Build qemu-log-panel
cd ~/workspace/qemu-log-panel
mvn package
That produces target/qemu-log-panel-1.0-jar-with-dependencies.jar.
5. Record a trace and import it
cd ~/workspace/xv6-riscv
make qemu2                                      # writes qemu.log, ctrl-a x to quit
make hsqldb DB_START=1000000 DB_COUNT=200000    # a window of it -> database.*
make riscv-simulator
make qemu2 reaches the xv6 shell in about 2 seconds at the default 16 MiB of guest
RAM. Let it get as far as you need and quit with ctrl-a x; the log is valid
however early you stop.
Import a window, not the whole log, and read the next two sections before changing guest RAM.
Guest RAM decides almost everything
Before worrying about the tracer, look at what xv6 actually does at boot. kfree()
fills every page it frees with junk:
memset(pa, 1, PGSIZE); // kernel/kalloc.cand xv6's memset writes one byte per iteration, three instructions each. At
boot, kinit() frees all of physical memory, so booting costs roughly
3 x RAM instructions no matter what else happens. With the stock -m 128M that is
32,730 pages x 4096 bytes x 3 = 402 million instructions, about 88% of the entire
trace, and 134 million of the memory accesses.
So guest RAM, not the tracer, sets the trace size. The Makefile exposes one knob,
GUESTMEM_MB, which drives both the kernel's PHYSTOP and qemu's -m so they cannot
drift apart:
GUESTMEM_MB |
instructions to shell | log | database |
|---|---|---|---|
| 16 (default) | 62 M | 1.8 GB | ~170 GB |
| 128 (stock xv6) | 455 M | 13.5 GB | ~1.26 TB |
16 MiB is plenty to boot and use the shell. usertests needs the full 128 —
sbrkmuch grows a very large address space and fails with less:
make qemu GUESTMEM_MB=128 # rebuilds the kernel automaticallyChanging GUESTMEM_MB recompiles the kernel, because the value is baked in. Do not
set qemu's -m by hand: a kernel built for more RAM than the machine has will fault
on memory that was never provided.
Log size vs database size
Even at 16 MiB these are very different, and the second one is what will bite you:
| per instruction | 62M-instruction boot | |
|---|---|---|
| qtrace log | 29 bytes | 1.8 GB, ~2 seconds |
| HSQLDB database | ~2,800 bytes | ~170 GB, ~25 minutes |
The database is ~90x larger than the log it came from, because every row stores all ~265 register columns whether they changed or not. Recording is cheap; importing is not.
So record everything, then import the part you care about:
make hsqldb DB_START=1000000 DB_COUNT=200000or directly:
java -jar target/qemu-log-panel-1.0-jar-with-dependencies.jar \
     -f qemu.log -t --start 1000000 --count 200000
Records before the window are still replayed, because the delta format needs their
register state to know what the registers hold when the window opens, but they are not
inserted. The sequence column keeps the true instruction index, so row 1,000,000
is instruction 1,000,000 of the run and lines up with the log.
To bound the log itself instead, cap the trace when recording:
make qemu2 QTRACE_ARGS="out=qemu.log,stop=5000000".
Or skip the import entirely
The panel can browse a qemu.log where it lies, with no database at all:
java -jar target/qemu-log-panel-1.0-jar-with-dependencies.jar -g -f qemu.log
java -jar target/qemu-log-panel-1.0-jar-with-dependencies.jar -g -f qemu.log -j dump.json
-f without -t now means "open this log", where before it did nothing. The Open
button offers the same choice, and -d still connects to an imported database, so
nothing about the old path changes.
Comparing a log against the simulator's database
riscv-simulator writes its records into a quantr table in an HSQLDB. Give both
options and each side is read from where it already is - qemu records out of the log,
simulator records out of the database - with no import on either side:
java -jar target/qemu-log-panel-1.0-jar-with-dependencies.jar -g -f qemu.log -d database-d on its own still expects a database holding both tables, which is what make hsqldb produces. A database written by the simulator alone has no qemu table, and
the panel says so and points at -f rather than failing on the first query.
| import to HSQLDB | read the log | |
|---|---|---|
| 64.7M records, 2.0 GB log | ~170 GB, tens of minutes | 16 MB index, 10 s |
| opening it again | instant | 56 ms (index is cached) |
| any page of 10,000 rows | instant | ~250 ms |
A record only lists the registers that changed, so the state at record N depends on
every record before it and the file cannot simply be read from the middle. On first
open the log is scanned once and, every 8192 records, the byte offset and a snapshot of
the whole register file are recorded. Reading a page then means seeking to the nearest
checkpoint and replaying at most 8192 records, which is why page cost does not grow
with position in the file. The index is cached as <log>.qtidx and rebuilt whenever
the log's length or timestamp change.
Everything works the same either way: paging, jump to row, search, next error, next
change, the diff panel, List Error, Compare, -i and -e. Two differences worth
knowing:
-iis instant on a log: the qemu count comes from the cached index, and a log cannot have gaps in its sequences since they are just positions in the stream. It still opens the database for the simulator count, and only looks for gaps when there is an importedqemutable.- Comparison needs a simulator side. That is either a
quantrtable, which may sit in its own database paired with the log by-f qemu.log -d database, ordump.jsonvia-j. The Compare dialog only uses its SQL join when both tables are in the same database; otherwise it walks the range.
Import when you want SQL over the trace, or the quantr table workflow. Read the log
for everything else.
Comparing without the window
--diff runs the same comparison on the terminal and prints the registers that
disagree, for when a window is not an option - over ssh, or as a check in a script that
a simulator change did not break anything:
java -jar target/qemu-log-panel-1.0-jar-with-dependencies.jar -f qemu.log -d database --diffIt walks the range the simulator recorded, which is usually a window rather than a whole
boot, and reports each differing record with its sequence, pc and disassembly. --limit
caps how many it prints (20 by default, 0 for all). The exit status is 0 when everything
matched, so it can gate a build.
comparing sequence 70,930,000 to 70,942,713
12,713 record(s) compared, 0 differ
Recording traces
make qemu2
qemu2: $K/kernel fs.img
    $(QTRACE_QEMU) $(QEMUOPTS) -plugin $(QTRACE_PLUGIN),$(QTRACE_ARGS)
Note what is not there any more: no -accel tcg,one-insn-per-tb=on, no nochain,
no -d exec,cpu,in_asm,int, no -D. The plugin writes its own file directly, and
letting QEMU keep its normal translation blocks is a large part of the speed-up.
Plugin options
Pass them with make qemu2 QTRACE_ARGS="out=qemu.log,stop=5000000".
| option | default | meaning |
|---|---|---|
out=PATH |
qemu.log |
output file. With -smp N>1, writes PATH.0, PATH.1, … one per hart |
stop=N |
0 (off) |
quit after N instructions — the easy way to bound log size |
counters=on |
off |
include mcycle/minstret/cycle/instret/time. They change every instruction, so this roughly triples the log and cannot be compared against a simulator |
hwaddr=on |
off |
resolve the physical address and memory-region name for each access. Costs ~30% speed. Required for memHiJack / MMIO detection and the quantr.xml export |
mem=off |
on |
drop memory access records |
fpu=off |
on |
drop floating point registers |
disas=off |
on |
drop the =PC text disassembly lines |
csrperiod=N |
1024 |
force a CSR re-scan every N instructions, so asynchronously changing bits like mip cannot go stale for longer than that. 0 disables |
verify=on |
off |
audit the decoder: read every register each instruction and report anything the fast path missed. Slow; use to prove correctness after changing the decoder |
If you use -e quantr.xml, record with hwaddr=on — that is what identifies MMIO
accesses.
Log format
#qtrace 1 arch=riscv64 hart=0 regs=265 counters=off mem=on
#format '@PC' opens a record; ' name value' is a changed register; ...
@80000c60                                     record: the PC about to execute
 x15/a5 22                                    a register that changed
 priv S                                       privilege mode, when it changes
> mem load (), 0x80008868, 0x0, 0x1a, 8       vaddr, paddr, value, size
=80000c60 csrr  a5,sstatus                    disassembly, emitted once per PC
riscv_cpu_do_interrupt: hart:0, async:1, ...  a trap
Points worth knowing when reading a log by hand:
A record holds the state before its instruction executes, which is the state the previous instruction left behind — same convention as the old -d cpu dump. The first record contains every register, so the file is self-contained and column discovery still works by reading the head of it. pc is in the @ header, not repeated as a register line. Values are lower-case hex with no 0x and no zero padding.
> mem lines are byte-compatible with the old plugin, and riscv_cpu_do_interrupt: lines are byte-compatible with -d int (qtrace reconstructs them from the trap CSRs).Memory accesses appear inside the record of the instruction that performed them. In the old format they landed in the following record.
The whole format follows from one decision: a record says only what changed. The
old -d cpu dump reprinted all ~230 register values for every instruction, which is
why it cost 7,143 bytes each. Real code writes about 0.35 registers per instruction,
so a qtrace record averages ~30 bytes. Everything below is a consequence of that,
including the one real cost: since a record does not carry the machine state, a reader
has to carry it forward itself.
Line types
Every line is identified by its first character, which makes the format cheap to parse and cheap to split into chunks:
| first char | meaning |
|---|---|
# |
header / metadata, only at the top of the file |
@ |
opens a record — the PC about to execute |
| space | a register that changed |
= |
disassembly for that PC, emitted once ever |
> |
a guest memory access |
r |
riscv_cpu_do_interrupt: — a trap |
A record runs from one @ to the next.
A real extract
#qtrace 1 arch=riscv64 hart=0 regs=265 counters=off mem=on
#format '@PC' opens a record; ' name value' is a changed register; ...
@1000
 x0/zero 0
 x1/ra 0
 ...                          <- opening record: ALL 265 registers
=1000 auipc                   t0,0                    # 0x1000
@1004
 x5/t0 1000                   <- what the auipc at 0x1000 wrote
=1004 addi                    a2,t0,40
@1008
 x12/a2 1028
=1008 csrrs                   a0,mhartid,zero
@100c
=100c ld                      a1,32(t0)
> mem load (RAM), 0x1020, 0x1020, 0x80e00000, 8
@1010
 x11/a1 80e00000              <- what that ld loaded
Order within one record
@PC- registers changed by the previous instruction
riscv_cpu_do_interrupt:— only if a trap just happened=PC text— only the first time this PC executes> mem ...— accesses performed by this instruction
Steps 2 and 5 refer to different instructions, which is the one genuinely confusing
part. A record is a snapshot of the state before its instruction runs, so the
register lines are the previous instruction's effects — the same convention the old
-d cpu dump used — plus the memory traffic this instruction then generates.
In the old format the memory lines landed in the following record instead, because records were delimited by the end of the register dump.
Field formats
Registers are name, a space, then the value. Names match QEMU's own -d cpu
dump (x15/a5, mstatus, satp). Values are lower-case hex, no 0x, no zero
padding, so x5/t0 1000 means 0x1000. The one exception is priv, which is a
letter: priv S.
Memory is > mem load|store (device), vaddr, paddr, value, size:
> mem load (RAM), 0x1020, 0x1020, 0x80e00000, 8
> mem store (), 0x80008700, 0x0, 0x80000ec6, 8
The device name and physical address are only filled in with hwaddr=on. By default
that lookup is skipped, costing ~30% less time, and you get () and 0x0 as in the
second line. The device name is what distinguishes MMIO from RAM, so hwaddr=on is
required for memHiJack and the quantr.xml export.
Traps reproduce the old -d int line exactly, rebuilt from the trap CSRs:
@80005360
 sstatus 200000120
 sepc 80001dda
 scause 8000000000000005
 mstatus a000001a0
riscv_cpu_do_interrupt: hart:0, async:1, cause:5, epc:0x80001dda, tval:0x0, desc=s_timer
That is the first instruction of the trap handler, and its record carries the CSR changes the trap caused. Only four CSRs appear even though a trap forces a re-scan of all 265 — the re-scan still emits only what actually moved.
Two things that trip people up
pc is not a register line. It is the @ header. Emitting it twice would nearly
double the size of every record. If you are filling a pc column, take it from <@.>
The first record is a full dump. That makes the file self-contained, and it is how the complete register set is discovered by reading only the head of the file.
Reading it
state = {}
for line in f:
    c = line[0]
    if c == '@':
        emit(pc, state)                    # previous record is now complete
        pc = int(line[1:], 16)
    elif c == ' ':
        name, value = line.split()
        state[name] = value                # carry forward
    elif c == '>': ...                     # memory
    elif c == '=': ...                     # disassembly, key it by PC
The carry-forward is the only real difference from the old format. It is also why the parallel importer needs the extra step described under "How chunks still import in parallel": a chunk starting in the middle of the file has no idea what the registers held when it began.
What changes the format
counters=on adds mcycle/minstret/cycle/instret/time back. fpu=off drops
the floating point registers, mem=off drops > mem lines, disas=off drops =
lines. With -smp N>1 you get one file per hart, qemu.log.0, qemu.log.1, …, each a
complete independent stream in this same format.
How qtrace works
qtrace is a QEMU TCG plugin: QEMU calls into it as it translates and runs guest
code. The whole design comes from one observation. The old recipe asked QEMU to print
the machine state after every instruction, and printing those ~230 values costs 7,143
bytes and a few hundred fprintf calls each time. But real code changes about 0.35
registers per instruction, and 192 of the 232 registers printed never change at all
during a boot. Almost all of that work was spent re-stating things that had not moved.
So qtrace does two things: it works out in advance what each instruction can change, and it writes only what actually changed.
The two phases
The key is that QEMU translates a block of guest code once and then runs it many times. Anything qtrace can decide at translation time is paid for once, no matter how many millions of times the instruction executes.
flowchart TD
    Guest["guest code"] --> Translate["QEMU translates a block"]
    Translate --> TbTrans["vcpu_tb_trans, once per translation"]
    TbTrans --> Decode["decode_insn: what can this instruction write?"]
    TbTrans --> Disas["qemu_plugin_insn_disas, first time this PC is seen"]
    Decode --> Meta["InsnMeta: pc, write kind, target register"]
    Disas --> Meta
    Meta --> Register["register an execution callback carrying that metadata"]
    Register --> Run["QEMU runs the block, over and over"]
    Run --> VcpuInsn["vcpu_insn, once per execution"]
    VcpuInsn --> Out["one record appended to the buffer"]
What the decoder decides
decode_insn() looks at the raw instruction bytes and answers one question: which
registers could this write? There are three answers.
| answer | meaning | examples | cost at run time |
|---|---|---|---|
WR_NONE |
writes nothing we track | stores, branches, fences | nothing to read |
WR_GPR |
exactly one integer register, known now | addi, lw, jal, c.mv |
one register read |
WR_ALL |
could change anything | floating point, CSR writes, ecall, mret, unknown encodings |
full re-scan |
The important property is the direction of the fallback. Anything the decoder does not
positively recognise becomes WR_ALL, which re-reads everything. A gap in the decoder
therefore costs speed and never accuracy. That is what makes it safe to hand-write a
decoder for a 32-bit and 16-bit instruction set and still trust the output.
One refinement matters a lot in kernel code: csrrs rd, csr, x0 - which is how csrr
is encoded, and how xv6 reads sstatus on every spinlock - does not write the CSR at
all, because the source operand is zero. Recognising that turns a very common
instruction from a full re-scan into a single register read.
What happens per instruction
flowchart TD
    Start["vcpu_insn for the instruction about to run"] --> Header["write '@PC'"]
    Header --> Check{"trap pending, first record,<br/>or previous instruction was WR_ALL?"}
    Check -->|yes| Full["read all 265 registers,<br/>emit only those that moved"]
    Check -->|no| Kind{"what did the previous<br/>instruction write?"}
    Kind -->|WR_GPR| One["read that one register,<br/>emit it if it moved"]
    Kind -->|WR_NONE| Skip["emit no registers"]
    Full --> TrapQ{"was it a trap?"}
    TrapQ -->|yes| TrapLine["rebuild the riscv_cpu_do_interrupt line<br/>from scause, sepc, stval, or the M-mode equivalents"]
    TrapQ -->|no| DisasQ{"first time this PC has run?"}
    One --> Sweep{"csrperiod elapsed?"}
    Skip --> Sweep
    Sweep -->|yes| Csr["sweep the CSRs for anything<br/>that changed on its own, such as mip"]
    Sweep -->|no| DisasQ
    Csr --> DisasQ
    TrapLine --> DisasQ
    DisasQ -->|yes| EmitDisas["emit '=PC disassembly'"]
    DisasQ -->|no| Done
    EmitDisas --> Done["record complete"]
Note that a record describes the state the previous instruction left behind, which
is exactly the state this one starts from. That is why the register lines in a record
belong to the instruction before it, and it matches the convention the old -d cpu
dump used.
Three things happen outside this path:
- Memory.
vcpu_memfires for each access while the instruction runs, so> memlines land inside the record of the instruction that performed them. The value comes fromqemu_plugin_mem_get_value(), which is what QEMU already had to compute. - Traps.
vcpu_disconfires when QEMU takes an interrupt or exception. It cannot know what the trap did, so it just sets a flag: force a full re-scan, and discard the expectation about the previous instruction, which may never have retired. - Asynchronous CSRs. Interrupt pending bits move with no instruction involved, so a
periodic sweep (
csrperiod, 1024 by default) bounds how stale they can get. It usually finds nothing and so costs no bytes.
Getting out of the way of the I/O
Even 29 bytes per instruction is 12.5GB over a full boot, so the write path matters. Each vCPU
formats records by hand into its own 32MB buffer and hands it to write(2) in whole
blocks. There is no printf, no stdio locking, and no shared state between vCPUs -
with -smp N each hart writes its own file. Numbers are formatted with a small hex
routine rather than %lx.
This is also why the old recipe's -accel tcg,one-insn-per-tb=on and nochain are
gone. Those force QEMU out of its translation cache on every instruction; qtrace does
not need them, because a per-instruction callback fires just as reliably inside a
large translated block.
Proving the fast path
The decoder is an optimisation, and an optimisation that silently drops a register write would be worse than useless in a tool built for comparing against a simulator. So it can audit itself:
make qemu2 QTRACE_ARGS="out=qemu.log,verify=on,stop=5000000"verify=on reads the whole integer register file after every instruction and reports
anything that changed without the decoder predicting it. It reports 0 mispredicted
writes over 5 million instructions, and it found two real bugs while the decoder was
being written. Run it after touching decode_insn.
Compatibility with older logs
Nothing was removed. The importer picks the reader from the first line of the file.
| target | what it produces |
|---|---|
make qemu2 |
qtrace delta log (fast) |
make qemu2-fulldump |
the original full-dump recipe, unchanged, for cross-checking |
make qemu3 |
the older "mem plugin + int + MMIO trace" recipe |
If you have a tool that can only read the old full dump, expand a slice of a qtrace log back into it:
make window WINDOW_START=1000000 WINDOW_COUNT=50000
# -> qemu-window.log, in the classic -d exec,cpu,in_asm format
or directly:
python3 ~/workspace/q/contrib/plugins/qtrace-expand.py qemu.log \
        --start 1000000 --count 50000 -o window.log
Expanding everything is possible but pointless — the full dump is ~200x larger than the delta log it came from.
Removed
The old setup patched QEMU to add qemu_plugin_read_guest_virt_mem() and used it to
re-read guest memory after each access. qtrace uses qemu_plugin_mem_get_value()
instead, which is both faster and safer: re-reading through
cpu_memory_rw_debug() performs a real device read on MMIO, so tracing a UART or
virtio register could consume data and change the behaviour of the guest being
observed.
Known gaps
irqRequest*columns are no longer populated. They came from-d trace:sifive_plic_irq_request, which wrote to QEMU's own log file rather than the plugin's. Interrupts themselves are still recorded.memHiJack*columns needhwaddr=on; without the region name there is no way to tell MMIO from RAM.- The
V(virtualisation mode) field is not emitted. The parser has always ignored that line, and it is only meaningful with the hypervisor extension.
The source, file by file
QEMU side, in qtrace/
qtrace.c — the whole tracer, one self-contained TCG plugin. No patch to QEMU
itself. The parts worth knowing about:
| section | what it does |
|---|---|
out_flush / out_claim / put_hex |
per-vCPU 32MB buffer written with raw write(2), hex formatted by hand. stdio and a lock several hundred times per instruction was a large part of the old cost |
decode_insn |
decodes one RISC-V instruction at translation time to work out which register it can write, so at run time only that register is read back instead of all 270. Anything not positively recognised returns WR_ALL and forces a full re-scan, so a gap in the decoder costs speed, never accuracy |
vcpu_insn |
the per-instruction callback: writes the @PC header and the registers that changed |
vcpu_mem |
memory accesses, using qemu_plugin_mem_get_value() |
vcpu_discon |
traps; forces a full re-scan because a trap rewrites priv and several CSRs behind our back |
emit_trap_line |
rebuilds the old riscv_cpu_do_interrupt: line from the trap CSRs |
verify_decode |
verify=on: reads every register each instruction and reports anything the fast path missed |
qtrace-expand.py — replays a delta log and prints the classic
-d exec,cpu,in_asm dump, for tools that only understand the old format.
xv6-riscv.patch — adds the qemu2 / qemu2-fulldump / qemu3 / window /
hsqldb targets and the GUESTMEM_MB knob, and makes PHYSTOP derive from it.
Changes in this project
Format detection is automatic, in QtraceFormat.isQtrace() — it checks for the
#qtrace magic on the first line.
| file | change |
|---|---|
QtraceFormat.java |
new — format detection, column discovery, register-state seeding |
QemuRecordParser.java |
new applyQtraceLine(), folding one delta line into a carried state map |
LogChunk.java |
new netDelta / startState, the state a chunk ends with and starts from |
QemuLogChunkWorker.java |
alignAtRecordStart(), iterateQtraceRecords(), countChunkQtrace(), processChunkQtrace(); findChunks() and assignBases() handle both formats |
QemuLogPanel.java |
dispatches both passes on the detected format; getRegistersFromQemuLog() reads qtrace columns; new convertQemuLogToH2(file, bar, table, start, count) overload for windowed import |
MainFrame.java |
new --start / --count options |
Reading a log without importing it added these:
| file | change |
|---|---|
TraceSource.java |
new - where records come from: columnNames(), recordCount(), page(), findNextChange(), scan(), newReader() |
TraceRow.java |
new - the slice of ResultSet the table model actually used, so rows can come from either backend |
HsqldbTraceSource.java |
new - the original queries, moved behind the interface unchanged |
QtraceIndex.java |
new - the checkpoint index: build, sidecar cache, staleness check, PC to disassembly map |
QtraceFileSource.java |
new - seek to a checkpoint and replay; rows are lazy during a scan and materialised for a page |
MyTableModel.java |
loads from a TraceSource; the old File / Connection entry points still work |
CompareDialog.java, ListErrorDialog.java |
take a source; List Error gives each worker thread its own reader |
Two more fixes fell out of this:
- dump.json comparisons worked at all. Every row was marked as an error unless a
quantrtable was present, which made the M column and List Error useless in the documented dump.json workflow. - Missing disassembly. The parallel import fills its PC-to-code cache as chunks
happen to encounter
=PClines, and qtrace only emits each one once, so a chunk that starts after that point leavesCODEnull. On a 500,000 record log that was 30,977 rows. The index collects every=line up front, so reading the log always has it.
Three behaviours improved along the way:
memSizeis now recorded. The legacy parser hard-coded it to0.memHiJackis derived from the memory-region name in the> memline, so MMIO accesses are still identified without the separatememory_region_ops_*trace (needshwaddr=on).- The legacy reader now fails fast instead of running out of memory. It buffers lines
until it sees
x28, so pointing it at a log that has no such line made it read the entire file into oneArrayList<String>. It now gives up after 100,000 lines with an explanation. - An import now deletes the previous database files before it starts. An import that
died part way through used to leave an inconsistent set behind (a
.backupor.logwith no matching.data), after which every later attempt failed withData File input/output error: database files not completeand the user had to work out which files to delete by hand.
How chunks still import in parallel
A delta log cannot be split naively: a chunk in the middle of the file has no idea
what the registers held when it began. Rather than give up the parallel importer, the
existing two-pass structure is reused — the same trick the code already used to carry
priv across chunks:
- Count pass (parallel) — each chunk counts its records and records its net effect on the register file, the last value written to each register.
assignBases()(sequential, cheap) — composes those into a start state:state(n) = state(n-1)overridden by the net writes of chunkn-1. Chunk 0 starts empty because qtrace opens with a full dump.- Insert pass (parallel) — each chunk seeds its running state from
startStateand applies deltas as it goes.
Verified by comparing the resulting database against a single-threaded replay of the same log, sampling rows either side of every chunk boundary: identical.
Usage
java -jar target/qemu-log-panel-1.0.jar -gCommand line convert qemu log to HSQLDB
java -jar target/qemu-log-panel-1.0.jar -f qemu.log -tImport only a window of it (see "Log size vs database size" above)
java -jar target/qemu-log-panel-1.0.jar -f qemu.log -t --start 1000000 --count 200000Launch gui and load qemu log
java -jar target/qemu-log-panel-1.0.jar -g -f ../xv6-riscv/qemu.logConnect to HSQLDB database and show the gui
java -jar target/qemu-log-panel-1.0.jar -g -d ../xv6-riscv/databaseGenerate quantr.xml
quantrxml:
    java -jar ../qemu-log-panel/target/qemu-log-panel-1.0-jar-with-dependencies.jar -e ../riscv-simulator/quantr.xml
Generate HSQLDB database
hsqldb:
    java -jar ../qemu-log-panel/target/qemu-log-panel-1.0-jar-with-dependencies.jar -f qemu.log -t

info:
    java -jar ../qemu-log-panel/target/qemu-log-panel-1.0-jar-with-dependencies.jar -f qemu.log -d database -i
Parallel import (qemu.log → HSQLDB)
Large logs are imported with multi-threaded chunked read + batch insert.
See docs/parallel-qemu-log-import.md for the design and flowcharts.
Explain
This program will read the qemu.log into an HSQLDB database. To open it in SQuirreL SQL, follow these steps:
- Download https://squirrel-sql.sourceforge.io/
- Check optional drivers / add HSQLDB jar later
- Run Squirrel sql, if in mac it probably find wrong jdk, then edit "/Applications/SQuirreLSQL.app/Contents/MacOS/squirrel-sql.sh", add "JAVA_HOME="/Library/Java/JavaVirtualMachines/jdk-18.0.1.1.jdk/Contents/Home", to find out what jdk in your mac, type "/usr/libexec/java_home -V". Warning, you have to pick jdk home from "/usr/libexec/java_home -V", other than this will not work
- Download HSQLDB from https://hsqldb.org/
- Add hsqldb.jar to SQuirreL SQL (Driver class: org.hsqldb.jdbc.JDBCDriver, URL example: jdbc:hsqldb:file:/path/to/database)
Use this tool with XV6 and our simulator
- Use our xv6-riscv fork https://github.com/quantrpeter/xv6-riscv , make sure clone it in the same parent folder of riscv-simulator project
- make qemu2 , stop it by ctrl-a x, then you have qemu.log
- Run the riscv-simulator project to simulate the XV6, which writes its records into database.* (HSQLDB files)
- Now you have qemu.log and the simulator's database, we can do the comparison now
- Run this project in netbeans with
-g -f qemu.log -d database: the qemu side is read out of the log and the simulator side out of the database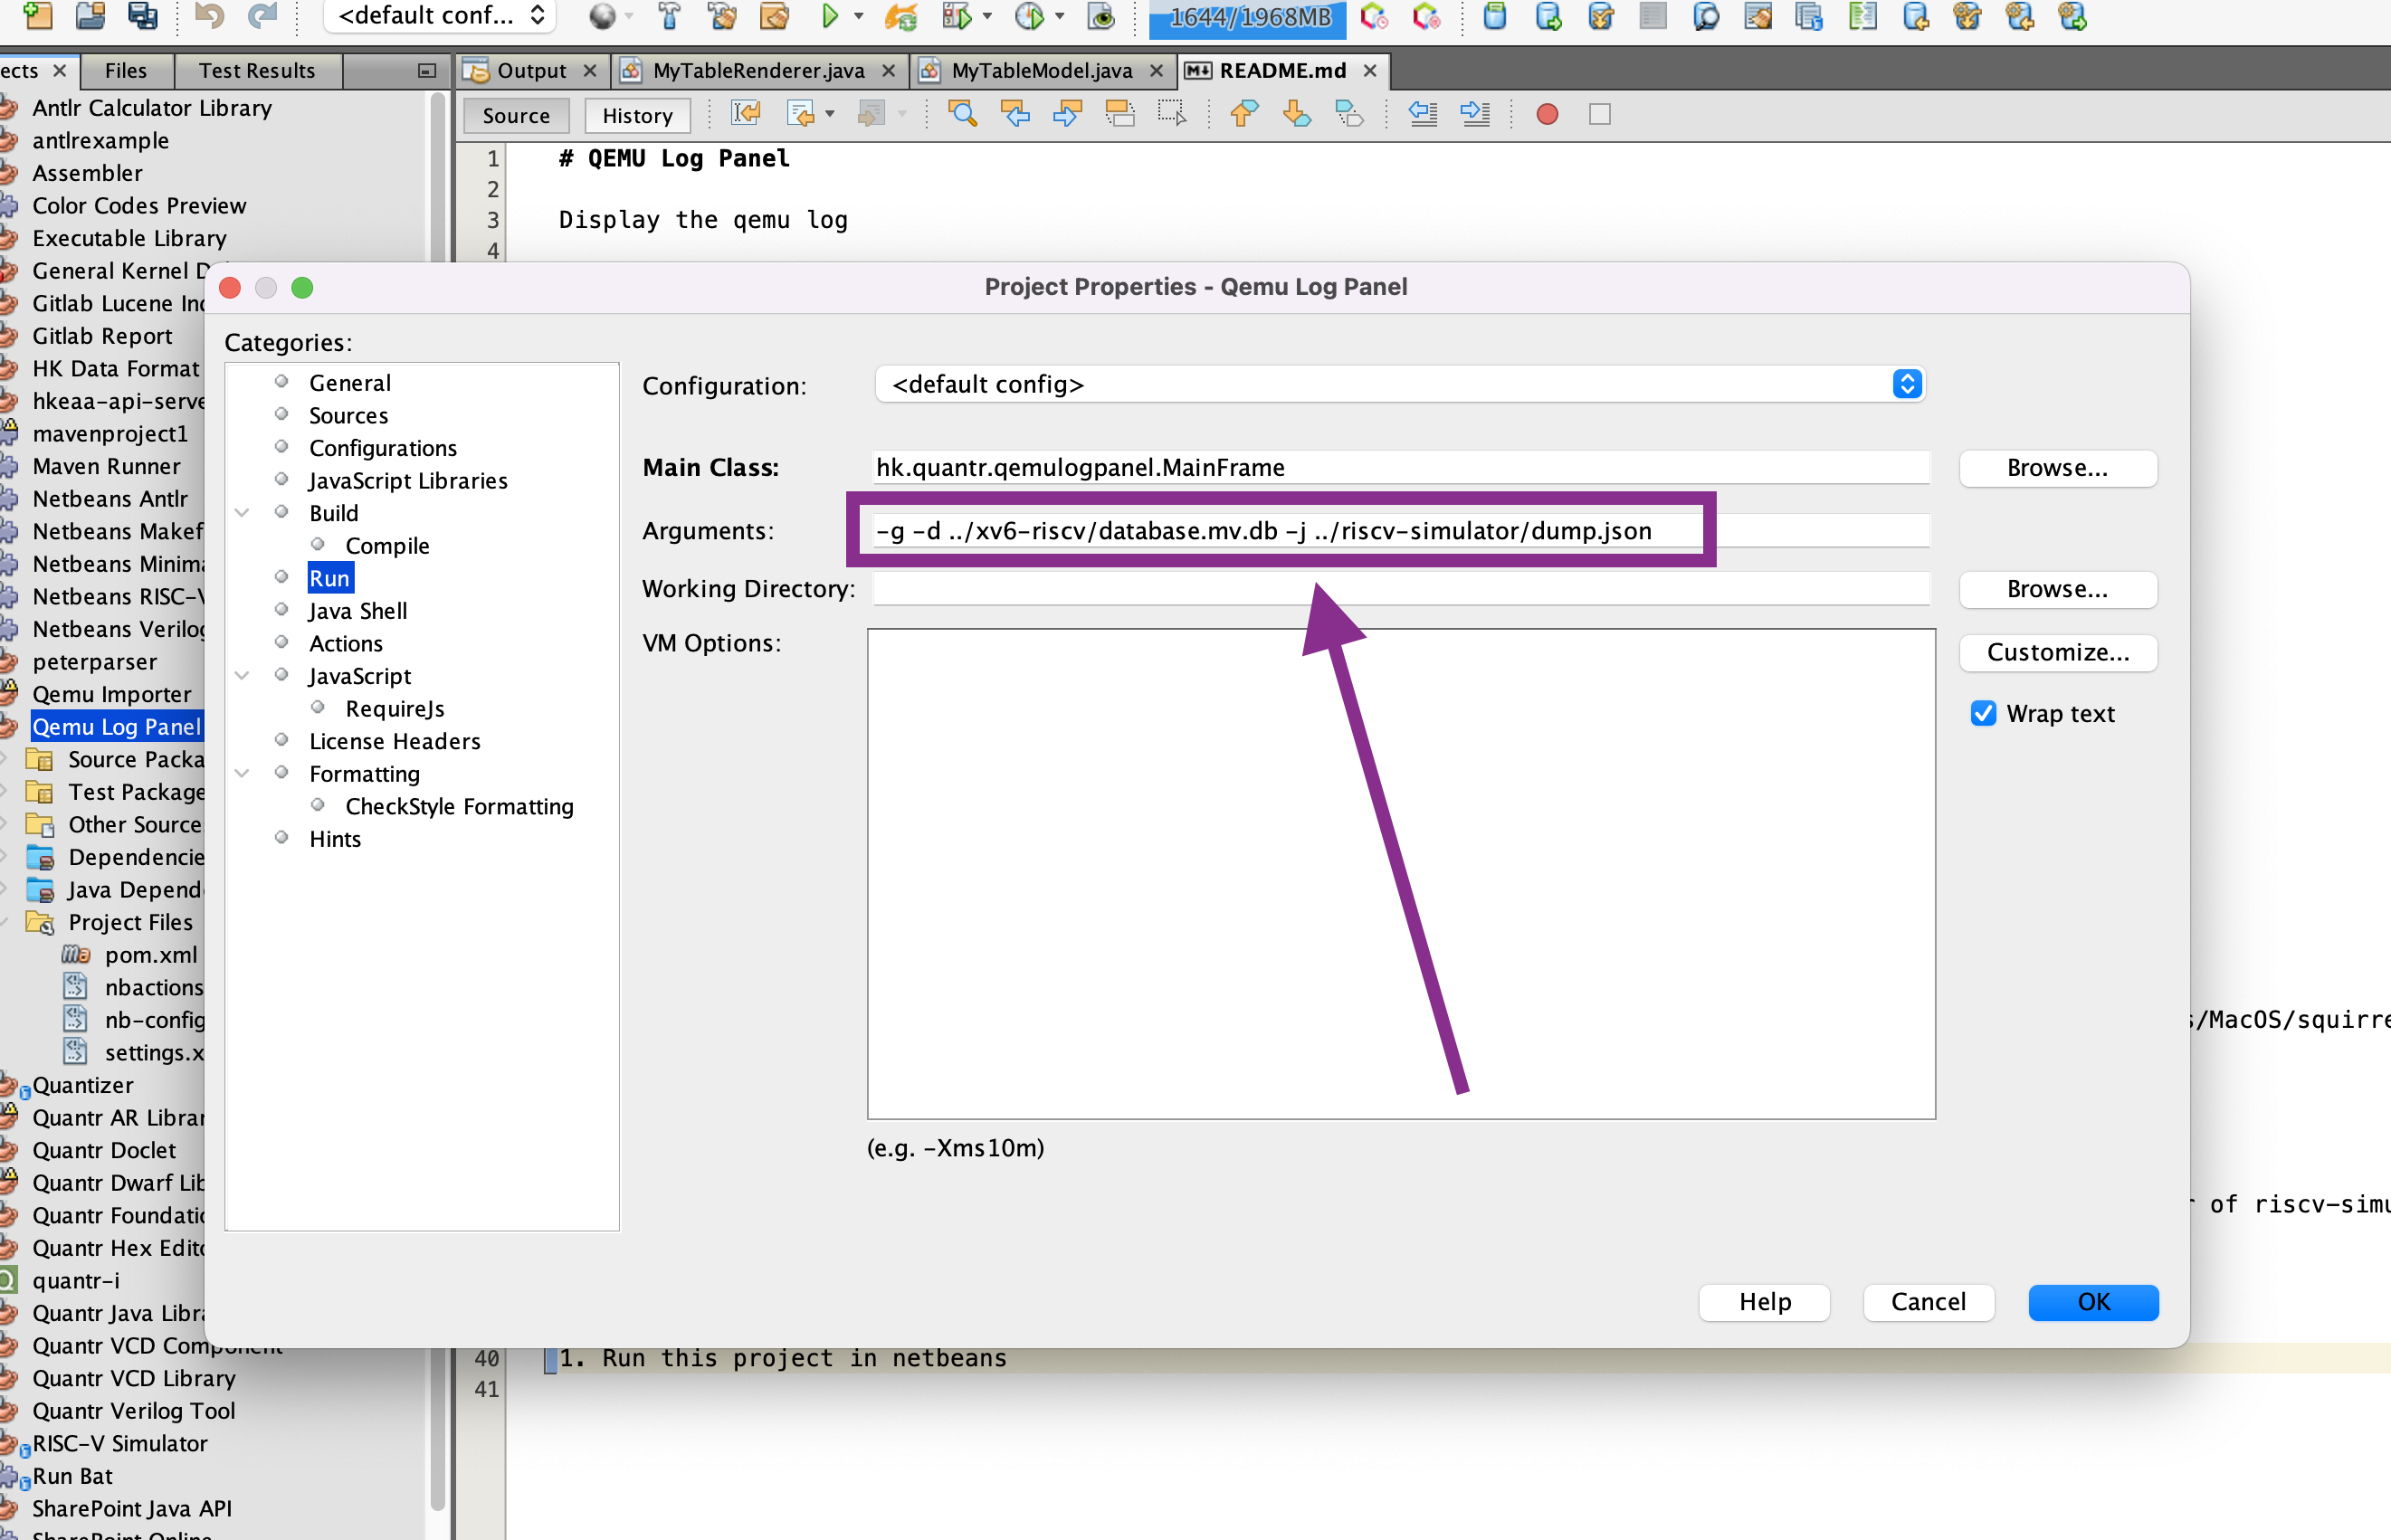
- Interface is popup as below
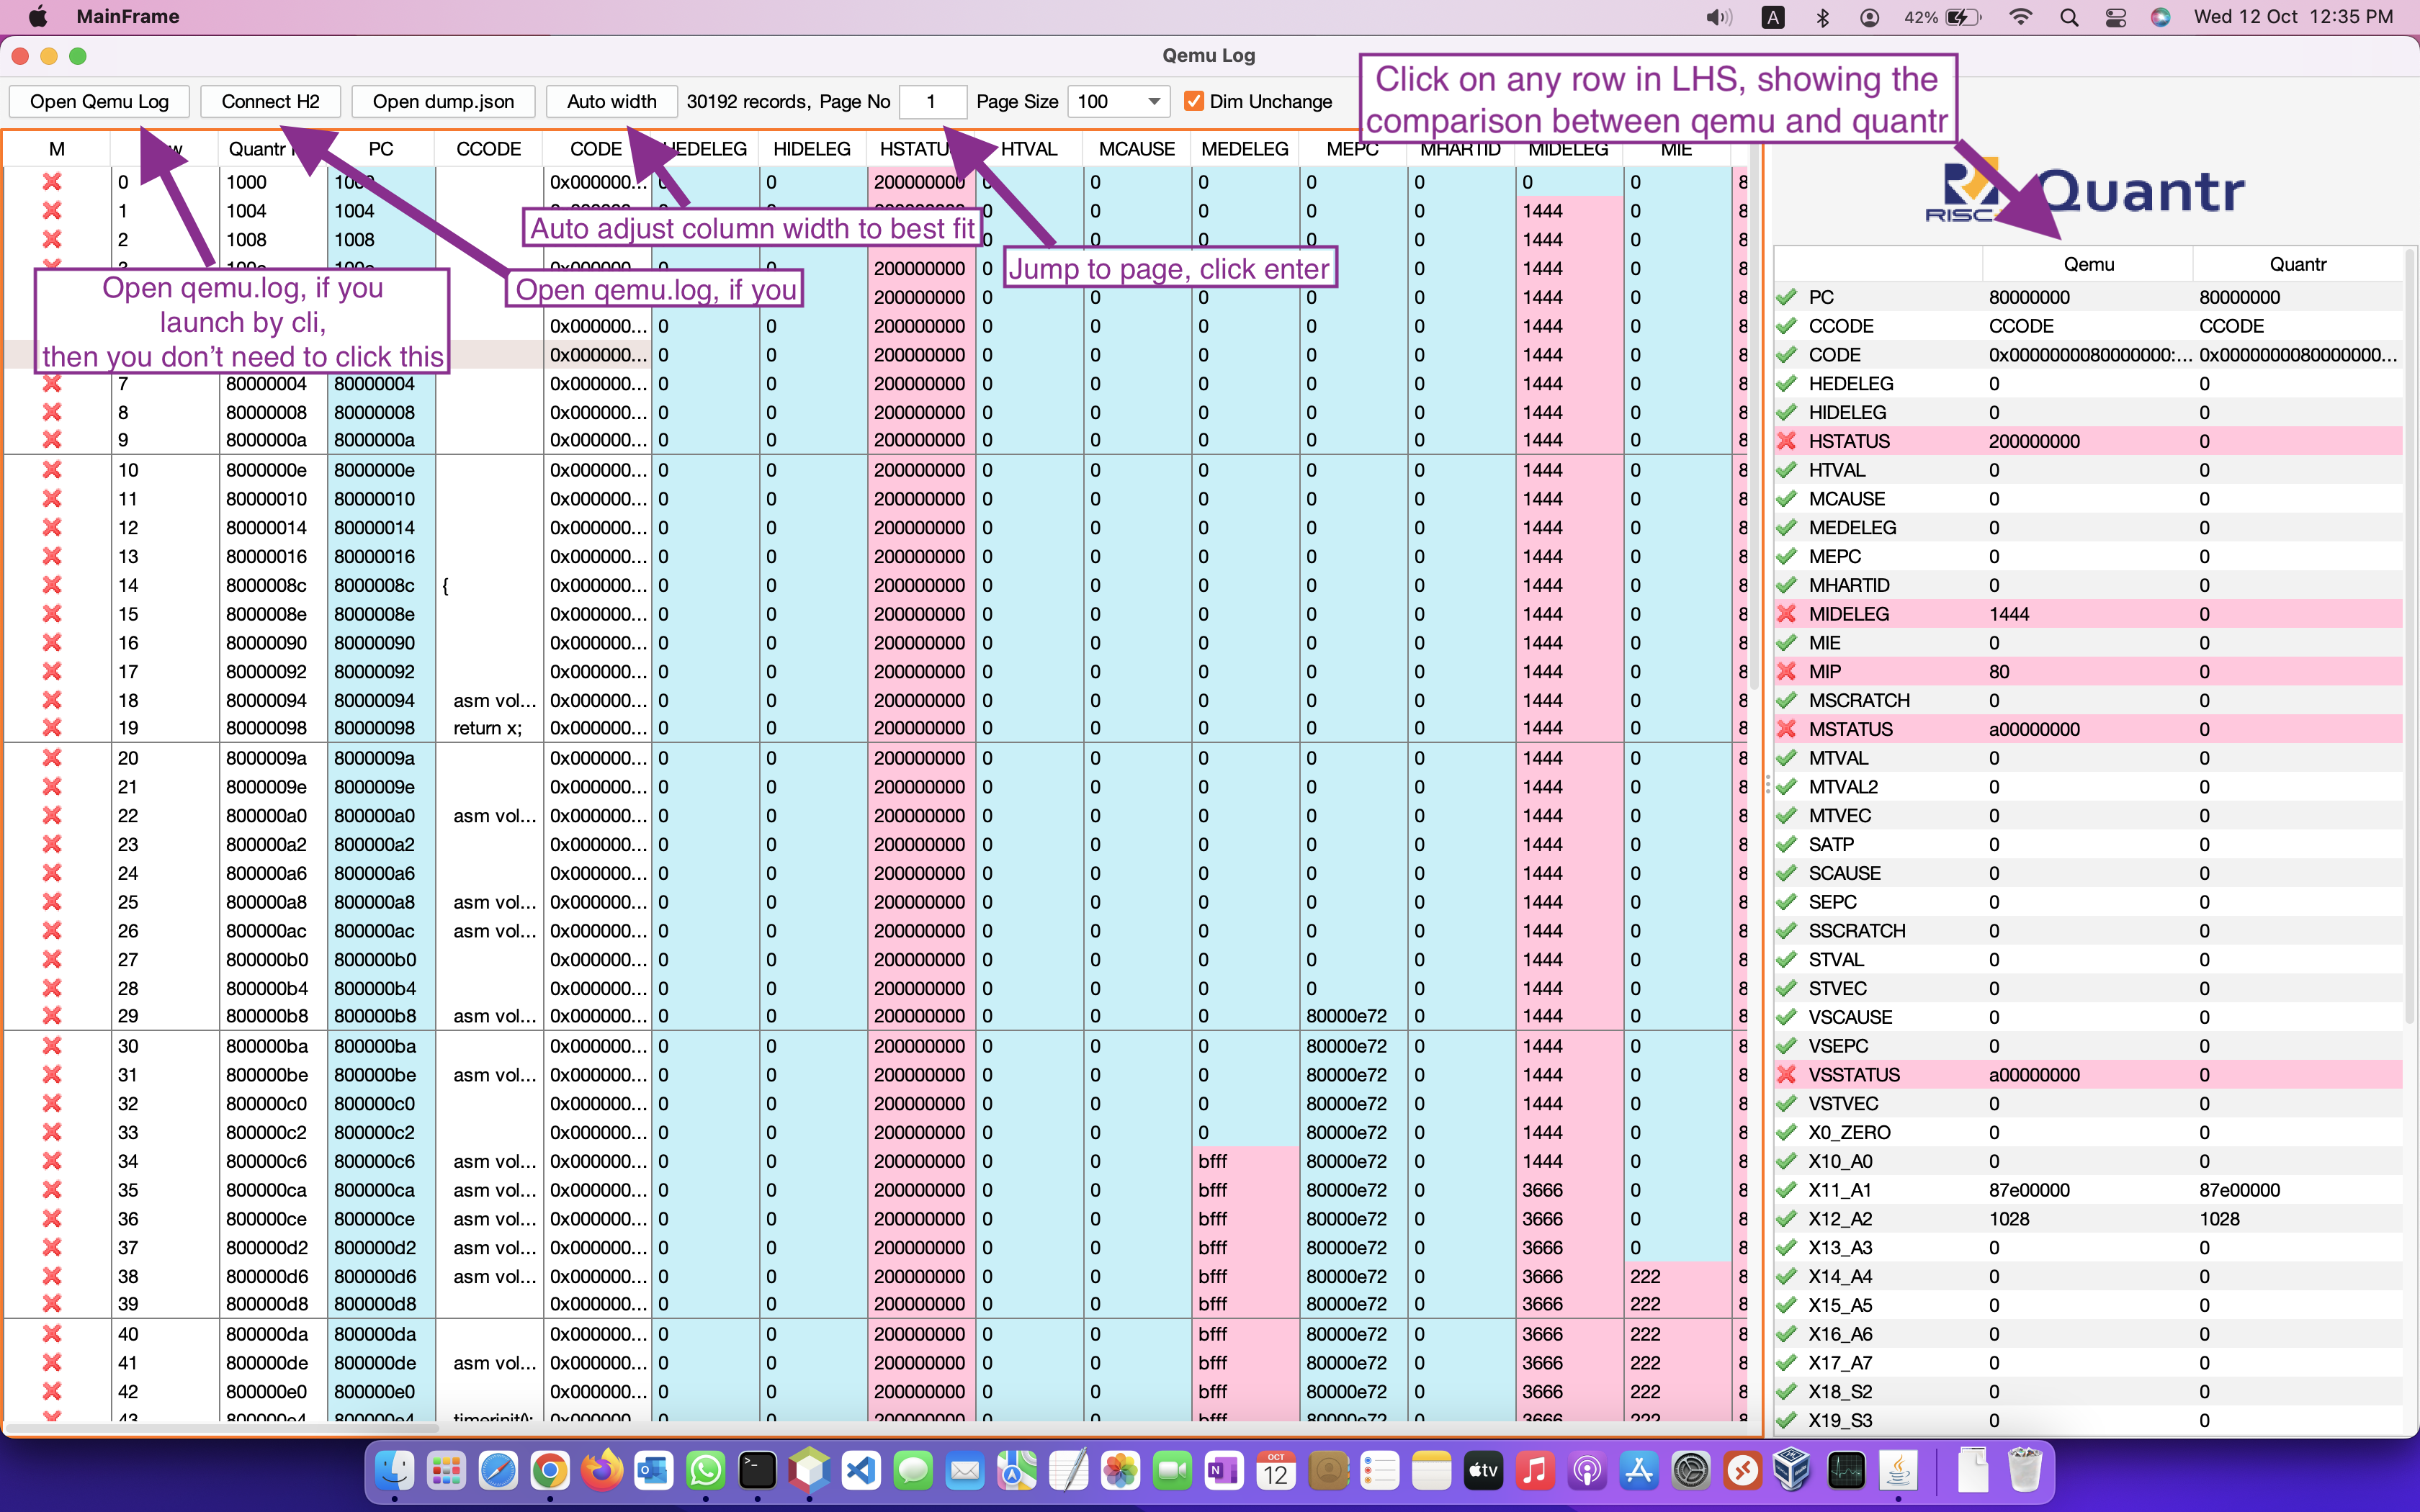
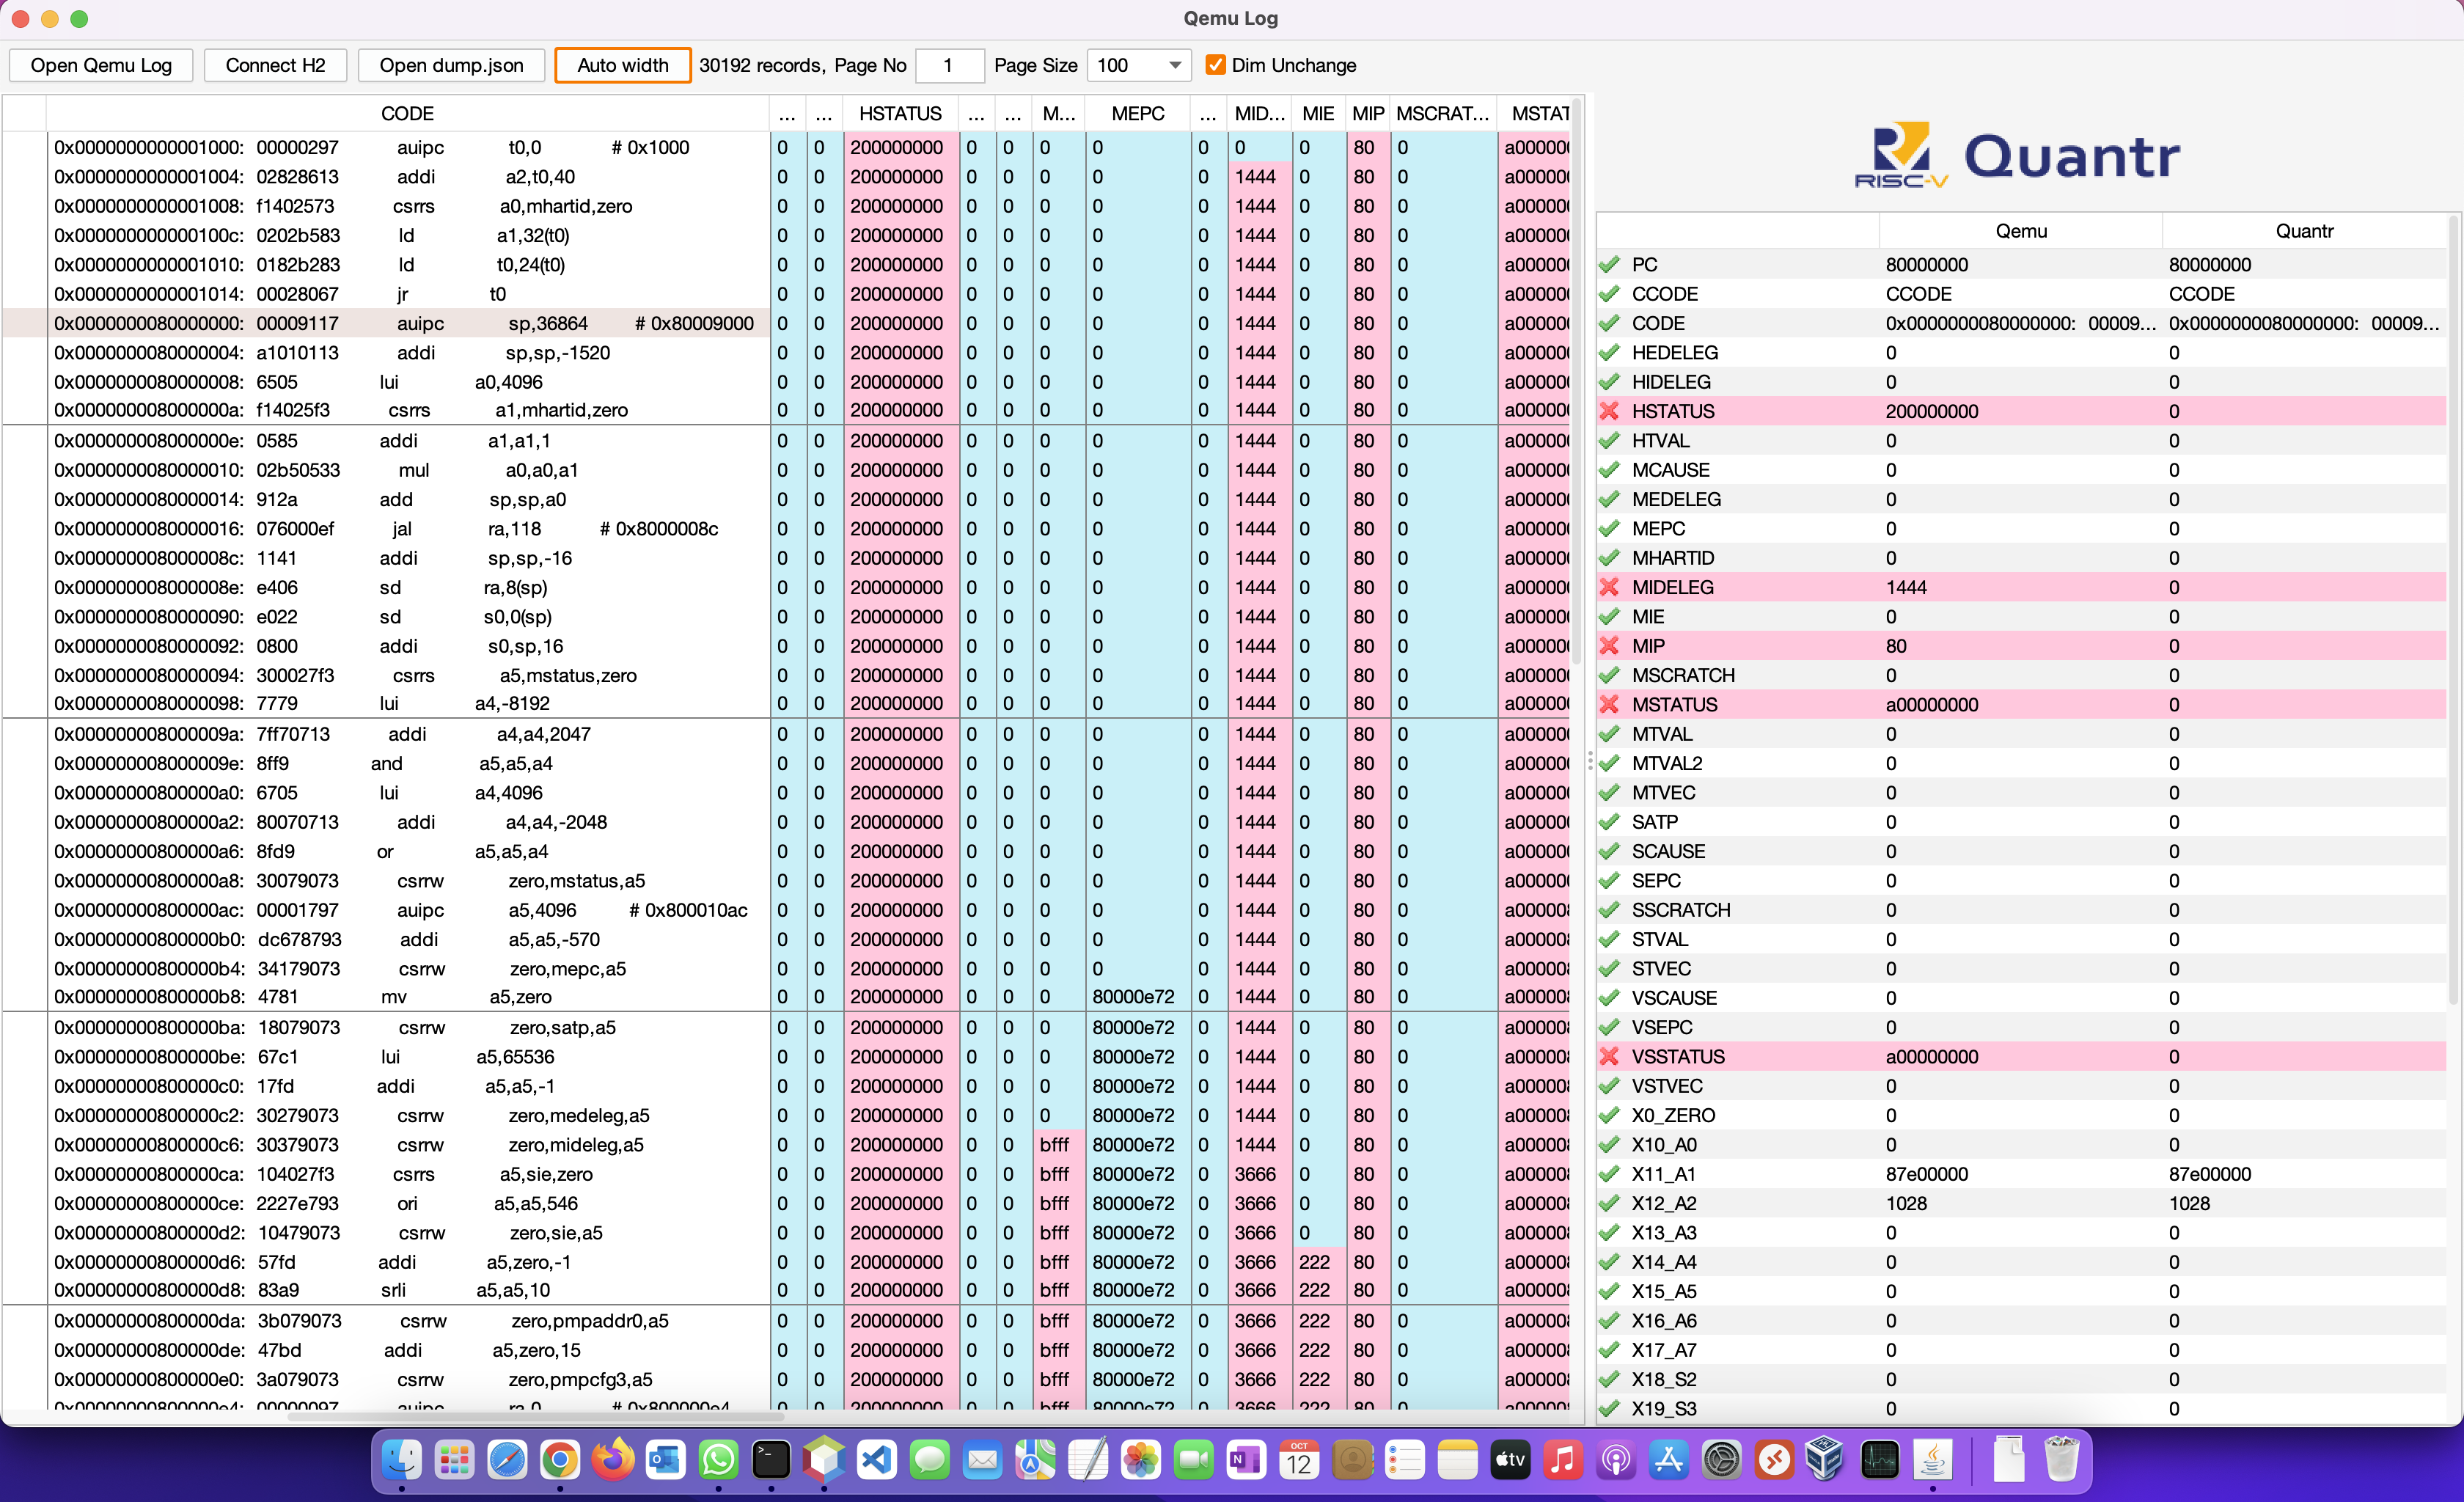
The simulator can dump.json instead of writing a database; pass that with -j dump.json in place of -d. Importing qemu.log with make hsqldb and connecting with
-d alone still works, but costs about 90x the disk the log takes.
Run in netbeans
run ui:
-g -f ../xv6-riscv/qemu.log -d ../xv6-riscv/database
run converting qemu.log to HSQLDB
-f qemu.log -t
wc/lc
Qemu-log-panel is using "wc -l" and "lc" to count how many line in qemu. "lc" is much faster, so install https://github.com/p-ranav/lc
Performance
script
#!/bin/bash
curl https://www.quantr.foundation/jdk-21_macos-aarch64_bin.tar --output jdk-21_macos-aarch64_bin.tar
tar xvf jdk-21_macos-aarch64_bin.tar
curl https://www.quantr.foundation/apache-maven-3.9.6-bin.tar.gz --output apache-maven-3.9.6-bin.tar.gz
tar zxvf apache-maven-3.9.6-bin.tar.gz
export JAVA_HOME=~/jdk-21.0.1.jdk/Contents/Home
export PATH=$JAVA_HOME/bin:~/apache-maven-3.9.6/bin:$PATH
mkdir workspace
cd workspace
scp -r -P 2207 <[email protected]:~/2TB/workspace/qemu-log-panel> .
scp -r -P 2207 <[email protected]:~/2TB/workspace/xv6-riscv> .
cd qemu-log-panel
Tests
mvn -Dtest=TestReadFileSpeed_BufferedReader --no-transfer-progress process-test-classes surefire:testmvn -Dtest=TestReadFileSpeed_BufferedReaderAndProcess --no-transfer-progress process-test-classes surefire:testmvn -Dtest=TestH2InsertSpeed --no-transfer-progress process-test-classes surefire:test
# (class name kept; backend is HSQLDB)mvn -Dtest=TestH2InsertSpeed_Tcp --no-transfer-progress process-test-classes surefire:testmvn -Dtest=TestH2InsertSpeed_Multithread --no-transfer-progress process-test-classes surefire:testModify QEMU (historical)
Log all instructions
https://peter.quantr.hk/2023/12/risc-v-qemu-doesnt-log-priv-in-every-instruction
Log all memory operations
https://peter.quantr.hk/2024/02/the-way-to-extend-qemu-tcg-plugin-functionality/
https://peter.quantr.hk/2024/01/qemu-risc-v-log-all-memory-operations/
Before qemu 9.0
qemu2: $K/kernel fs.img
    $(QEMU) $(QEMUOPTS) -singlestep -d exec,cpu,nochain,in_asm,int,trace:memory_region_ops_read,trace:memory_region_ops_write -D qemu.log
After qemu 9.0, Linux
qemu2: $K/kernel fs.img
    $(QEMU) $(QEMUOPTS) -accel tcg,one-insn-per-tb=on -d exec,cpu,nochain,in_asm,int,trace:memory_region_ops_read,trace:memory_region_ops_write,plugin -plugin ~/workspace/qemu/build/tests/plugin/libmem.so,callback=true -D qemu.log
After qemu 9.0, Mac
qemu2: $K/kernel fs.img
    $(QEMU) $(QEMUOPTS) -accel tcg,one-insn-per-tb=on -d exec,cpu,nochain,in_asm,int,trace:memory_region_ops_read,trace:memory_region_ops_write,plugin -plugin ~/workspace/qemu/build/tests/tcg/plugins/libmem.dylib,callback=true -D qemu.log
These still work and are kept as make qemu2-fulldump and make qemu3, but they
cannot record a whole boot in practical time. Use make qemu2 instead.
Notes
Netbeans run profile
Argument: -g -f qemu.log -d database
Working Direcotry: ../xv6-riscv



02:38:14.443
09:40:26.573